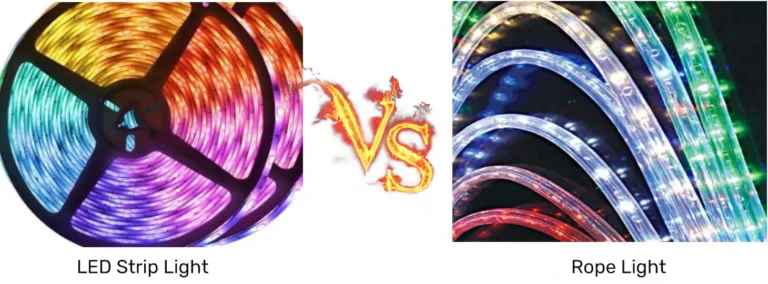
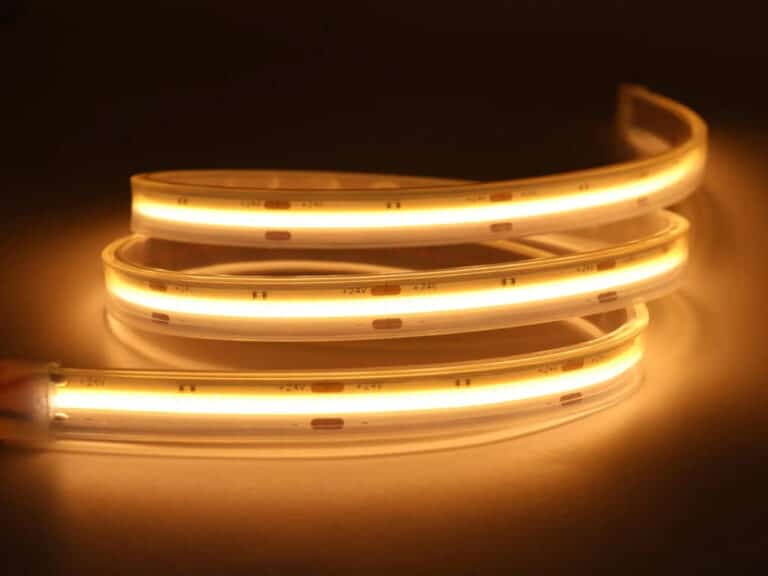
Taśmy LED są szeroko stosowane do dekoracji i oświetlenia, ale problemy ze spadkiem napięcia często powodują znaczne zmniejszenie jasności na końcach. Niniejszy raport, oparty na danych testowych produktów opracowanych przez dział inżynierii, ma na celu ocenę charakterystyki spadku napięcia i dostarczenie wskazówek dotyczących produkcji i instalacji.
Cel testowy
Niniejszy raport z testu, wypełniony przez dział inżynieryjny, przeprowadza systematyczne testy spadku napięcia dla taśm LED (w tym pasków SMD i COB). Celem jest zweryfikowanie wielkości spadku napięcia w standardowych paskach i, na podstawie danych testowych, ocena, czy konstrukcja taśmy jest rozsądna i spełnia wymagania użytkownika, umożliwiając w ten sposób dalsze ulepszenia.
Sprzęt pomiarowy i środowisko
- Multimetr cyfrowy (Fluke), regulowany zasilacz 12V/24VDC, lutownica o stałej temperaturze
- Temperatura: 28°C ±5°C
- Wilgotność: 65% ±5%
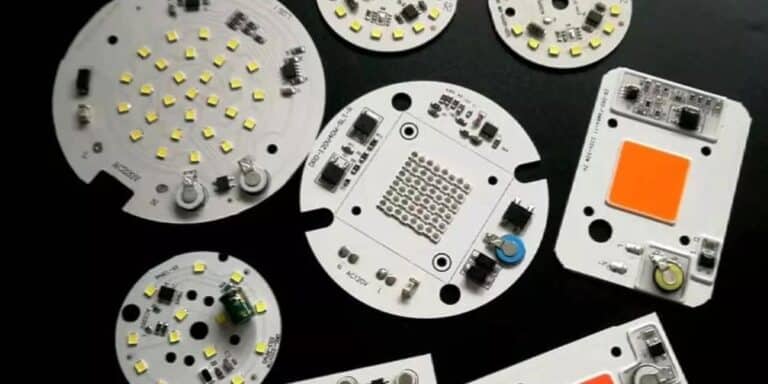
Próbka testowa
Łącznie 12 sztuk, w tym 6 sztuk Taśmy LED SMD i 6 sztuk Taśmy LED COB.
| Taśma LED SMD | ||||
| Pozycja | Nłacić LEDs | Napięcie | LZakres taśmy LED | PCB Szerokość |
| 1 | 60 diody LED/m | 12V | 10m | 8 mm |
| 2 | 120 diody LED/m | 12V | 10m | 8 mm |
| 3 | 120 diody LED/m | 24V | 10m | 8 mm |
| 4 | 120 diody LED/m | 24V | 5m | 5mm |
| 5 | 120 diody LED/m | prąd stały 24V | 5m | 10 mm |
| 6 | 240 ledów/m | 24V | 10m | 10 mm |
| Taśma LED COB | ||||
| Pozycja | Liczba diod LED | Napięcie | Długość paska LED | PCB Szerokość |
| 1 | 320 ledów/m | 12V | 5m | 8 mm |
| 2 | 320 ledów/m | 24V | 5m | 8 mm |
| 3 | 384 diody/m | 24V | 5m | 8 mm |
| 4 | 480 ledów/m | 12V | 10m | 8 mm |
| 5 | 528 LED/M | 12V | 5m | 10 mm |
| 6 | 528 LED/M | 24V | 10m | 10 mm |
Metoda testowania
1) Dostosuj zasilacz DC, aby wyprowadzić prawidłowe napięcie zgodnie ze specyfikacjami napięcia taśmy LED. Sprawdź dokładność napięcia za pomocą multimetru.
2) Sprawdź wartość napięcia w punkcie końcowym każdego metra taśmy LED za pomocą multimetru i zapisz dane.
3) Sprawdź aktualne dane dla każdego metra taśmy LED za pomocą multimetru. Oblicz moc na metr za pomocą wzoru P=UI i zapisz dane.
4) Po wykonaniu pomiarów napięcia i prądu dla każdego miernika lutuj następny metr paska LED za pomocą lutownicy. Powtarzaj kroki 2 i 3, aż testowanie osiągnie punkt końcowy.
5) Zapisuj i zachowaj wszystkie dane.
Dane testowe spadku napięcia LED SMD taśmy LED
| Napięcie opadać spróbowanie zgłaszać dla 60 diod LED/m 12V LED Pasek | ||||||||||||
| Długość | 1m | 2m | 3m | 4m | 5m | 6m | 7m | 8m | 9m | 10m | Moc (W) | PCB generator |
| 10m | 10.34 | 9.55 | 9.02 | 8.65 | 8.40 | 8.23 | 8.11 | 8.04 | 8.00 | 7.98 | 15.24 | Szerokość 8mm miedziak Grubość: 18/25 μm |
| 9m | 10.55 | 9.69 | 9.12 | 8.73 | 8.47 | 8.29 | 8.18 | 8.12 | 8.10 | 15.12 | ||
| 8m | 10.56 | 9.70 | 9.13 | 8.76 | 8.51 | 8.35 | 8.26 | 8.24 | 15.00 | |||
| 7m | 10.55 | 9.71 | 9.16 | 8.80 | 8.58 | 8.46 | 8.41 | 14.88 | ||||
| 6m | 10.54 | 9.73 | 9.21 | 8.89 | 8.72 | 8.67 | 14.40 | |||||
| 5m | 10.57 | 9.80 | 9.33 | 9.08 | 8.89 | 14.16 | ||||||
| 4m | 10.67 | 9.97 | 9.60 | 9.48 | 13.56 | |||||||
| 3m | 10.81 | 10.28 | 10.10 | 12.36 | ||||||||
| 2m | 11.14 | 10.84 | 9.79 | |||||||||
| 1m | 11.64 | 5.77 | ||||||||||
| Uwaga: Wartość środkowa reprezentuje napięcie, z jednostkami w woltach (V). | ||||||||||||
| Raport z testu spadku napięcia dla 120LEans/M 12V taśma LED | ||||||||||||
| Długość | 1m | 2m | 3m | 4m | 5m | 6m | 7m | 8m | 9m | 10m | Moc (W) | PCB Sklaczka |
| 10m | 10.49 | 9.66 | 9.11 | 8.74 | 8.48 | 8.30 | 8.18 | 8.10 | 8.06 | 8.04 | 24.00 | szerokość 8mm, miedziak Grubość: 35/35μm |
| 9m | 10.49 | 9.66 | 9.12 | 8.75 | 8.49 | 8.33 | 8.22 | 8.16 | 8.17 | 23.82 | ||
| 8m | 10.50 | 9.67 | 9.13 | 8.77 | 8.53 | 8.38 | 8.30 | 8.27 | 23.72 | |||
| 7m | 10.50 | 9.68 | 9.16 | 8.82 | 8.60 | 8.48 | 8.45 | 23.54 | ||||
| 6m | 10.51 | 9.72 | 9.22 | 8.91 | 8.74 | 8.69 | 23.19 | |||||
| 5m | 10.54 | 9.78 | 9.33 | 9.08 | 9.01 | 22.72 | ||||||
| 4m | 10.62 | 9.93 | 9.57 | 9.46 | 21.86 | |||||||
| 3m | 10.77 | 10.23 | 10.07 | 20.04 | ||||||||
| 2m | 11.05 | 10.82 | 16.20 | |||||||||
| 1m | 11.61 | 9.80 | ||||||||||
| Uwaga: Wartość środkowa reprezentuje napięcie, z jednostkami w woltach (V). | ||||||||||||
| Raport z testu spadku napięcia dla 120LEans/M 24V taśma LED | ||||||||||||
| Długość | 1m | 2m | 3m | 4m | 5m | 6m | 7m | 8m | 9m | 10m | Moc (W) | Specyfikacja PCB |
| 10m | 22.56 | 21.50 | 20.67 | 20.01 | 19.49 | 19.10 | 18.80 | 18.60 | 18.49 | 18.46 | 41.95 | szerokość 8mm, miedziak Grubość: 35/35μm |
| 9m | 22.58 | 21.56 | 20.76 | 20.14 | 19.67 | 19.31 | 19.08 | 18.94 | 18.89 | 41.00 | ||
| 8m | 22.63 | 21.64 | 20.88 | 20.31 | 19.89 | 19.61 | 19.43 | 19.38 | 40.15 | |||
| 7m | 22.70 | 21.75 | 21.06 | 20.56 | 20.21 | 20.01 | 19.94 | 38.40 | ||||
| 6m | 22.80 | 21.93 | 21.32 | 20.91 | 20.67 | 20.59 | 36.38 | |||||
| 5m | 22.91 | 22.14 | 21.66 | 21.37 | 21.28 | 33.36 | ||||||
| 4m | 23.06 | 22.48 | 22.13 | 22.02 | 29.47 | |||||||
| 3m | 23.28 | 22.89 | 22.77 | 24.00 | ||||||||
| 2m | 23.56 | 23.42 | 17.00 | |||||||||
| 1m | 23.91 | 9.00 | ||||||||||
| Uwaga: Wartość środkowa reprezentuje napięcie, z jednostkami w woltach (V). | ||||||||||||
| Napięcie opadać spróbowanie zgłaszać dla 120 diod LED/m 24V LED Pasek | ||||||||||||
| Długość | 1m | 2m | 3m | 4m | 5m | Moc (W) | PCB generator | |||||
| 5m | 23.33 | 22.92 | 22.63 | 22.47 | 22.42 | 21 | szerokość 5mm, miedziak Grubość: 35/35μm | |||||
| 4m | 23.52 | 23.21 | 23.03 | 22.97 | 17.70 | |||||||
| 3m | 23.65 | 23.39 | 23.34 | 13.90 | ||||||||
| 2m | 23.72 | 23.63 | 9.30 | |||||||||
| 1m | 23.95 | 4.80 | ||||||||||
| Uwaga: Wartość środkowa reprezentuje napięcie, z jednostkami w woltach (V). | ||||||||||||
| Napięcie opadać spróbowanie zgłaszać dla 120 diod LED/m 24V stały Aktualny LED Pasek | ||||||||||||
| Długość | 1m | 2m | 3m | 4m | 5m | Moc (W) | PCB generator | |||||
| 5m | 22.65 | 21.93 | 21.42 | 21.12 | 21.02 | 80.64 | Szerokość 10mm miedziak Grubość: 25/25 μm | |||||
| 4m | 22.92 | 22.41 | 22.11 | 22.00 | 63.12 | |||||||
| 3m | 23.25 | 22.94 | 22.83 | 47.52 | ||||||||
| 2m | 23.55 | 23.45 | 31.68 | |||||||||
| 1m | 23.84 | 16.08 | ||||||||||
| Uwaga: Wartość środkowa reprezentuje napięcie, z jednostkami w woltach (V). | ||||||||||||
| Napięcie opadać spróbowanie zgłaszać dla 240 diod LED/m 24V LED Pasek | ||||||||||||
| Długość | 1m | 2m | 3m | 4m | 5m | 6m | 7m | 8m | 9m | 10m | Moc (W) | PCB generator |
| 10m | 22.76 | 21.18 | 21.17 | 20.60 | 20.14 | 19.79 | 19.52 | 19.34 | 19.23 | 19.20 | 89.52 | Szerokość 10 mm miedziak Grubość: 25/25 μm |
| 9m | 22.80 | 21.95 | 21.27 | 20.74 | 20.32 | 20.00 | 19.80 | 19.68 | 19.64 | 86.80 | ||
| 8m | 22.88 | 22.08 | 21.45 | 20.97 | 20.62 | 20.37 | 20.22 | 20.18 | 83.52 | |||
| 7m | 22.96 | 22.22 | 21.65 | 21.24 | 20.95 | 20.78 | 20.73 | 78.91 | ||||
| 6m | 23.05 | 22.40 | 21.92 | 21.59 | 21.40 | 21.34 | 72.96 | |||||
| 5m | 23.18 | 22.62 | 22.24 | 22.58 | 21.96 | 65.40 | ||||||
| 4m | 23.33 | 22.91 | 22.66 | 22.58 | 55.92 | |||||||
| 3m | 23.51 | 23.23 | 23.15 | 44.44 | ||||||||
| 2m | 23.73 | 23.64 | 31.20 | |||||||||
| 1m | 23.97 | 16.00 | ||||||||||
| Uwaga: Wartość środkowa reprezentuje napięcie, z jednostkami w woltach (V). | ||||||||||||
Tabela statystyk wyników testów
| Pozycja | Lsedacja/m | Długość (m) | Napięcie rozruchowe (V) | punkt końcowy napięcie (V) | Napięcie Ddrętwy |
| 1 | 60 | 10 | 12 | 7.98 | 33.5% |
| 2 | 120 | 10 | 12 | 8.04 | 33.0% |
| 3 | 120 | 10 | 24 | 18.46 | 23.1% |
| 4 | 120 | 5 | 24 | 22.42 | 6.6% |
| 5 | 120 | 5 | 24 | 21.02 | 12.4% |
| 6 | 240 | 10 | 24 | 19.2 | 20% |
Analiza podsumowania
W przypadku pasków świetlnych 60 diody/m i 120 diody/m w tabelach 1 i 2 napięcie spada do odpowiednio 7,98 V i 8,04 V przy długości 10 metrów. Maksymalny spadek napięcia osiąga 33,5%, co wskazuje na znaczny spadek napięcia. Ponieważ zarówno paski 60-ledowe, jak i 120-ledowe składają się z trzech diod LED w serii (3 V x 3 = 9V), najlepiej spadek napięcia powinien być utrzymywany powyżej 9V. Dlatego wartości spadku napięcia dla tych dwóch pasków LED wymagają poprawy. Można to osiągnąć poprzez poszerzenie płytki drukowanej lub pogrubienie folii miedzianej lub sterowanie napięciem przewodzenia LED (VF) w zakresie poniżej 2,8V.
Tabele 3, 4, 5 i 6 wykorzystują zasilacz DC 24V z 6 diodami LED połączonymi szeregowo. Obliczamy napięcie wymagane dla diod LED w szeregu: 3V x 6 = 18V. Spośród wszystkich wartości testowych punktów końcowych, tabela 3 pokazuje najniższy spadek napięcia przy 18,46 V, przekraczając wymagania 18 V i zasadniczo spełniając napięcie dla 6 diod LED, kwalifikując się jako akceptowalne. Rysunek 5 wykorzystuje tryb stałego prądu, utrzymując stałą moc wyjściową 16 W/m na obu końcach z pomijalnym zanikem jasności, wykazując doskonałą spójność.
Przyczyny wysokiego spadku napięcia:
Wynika to przede wszystkim z nadmiernej długości i prądu paska, zwiększania rezystancji PCB i „zużywania” napięcia. Nadmierny spadek napięcia bezpośrednio powoduje zauważalne ściemnianie na końcu paska, a nawet może prowadzić do zniekształceń koloru.
KACZAN Dane testowe spadku napięcia taśmy LED
| Napięcie opadać spróbowanie zgłaszać dla 320 diod LED/m 12V KACZAN LED Pasek | ||||||||||||
| Długość | 1m | 2m | 3m | 4m | 5m | Moc (W) | PCB generator | |||||
| 5m | 11.40 | 11.07 | 10.87 | 10.77 | 10.73 | 25.20 | Szerokość 8mm miedziak Grubość: 25/25 μm | |||||
| 4m | 11.40 | 11.10 | 10.95 | 10.90 | 24.00 | |||||||
| 3m | 11.45 | 11.21 | 11.14 | 22.80 | ||||||||
| 2m | 11.56 | 11.45 | 19.20 | |||||||||
| 1m | 11.81 | 12.00 | ||||||||||
| Uwaga: Wartość środkowa reprezentuje napięcie, z jednostkami w woltach (V). | ||||||||||||
| Napięcie opadać spróbowanie zgłaszać dla 320 diod LED/m 24V KACZAN LED Pasek | ||||||||||||
| Długość | 1m | 2m | 3m | 4m | 5m | Moc (W) | PCB generator | |||||
| 5m | 23.58 | 23.26 | 23.03 | 22.90 | 22.86 | 33.60 | Szerokość 8mm miedziak Grubość: 25/25 μm | |||||
| 4m | 23.65 | 23.38 | 23.23 | 23.00 | 29.76 | |||||||
| 3m | 23.75 | 23.57 | 23.51 | 23.18 | 24.40 | |||||||
| 2m | 23.88 | 23.82 | 17.20 | |||||||||
| 1m | 24.00 | 9.00 | ||||||||||
| Uwaga: Wartość środkowa reprezentuje napięcie, z jednostkami w woltach (V). | ||||||||||||
| Napięcie opadać spróbowanie zgłaszać dla 384 diody LED/m 24V KACZAN LED Pasek | ||||||||||||
| Długość | 1m | 2m | 3m | 4m | 5m | Moc (W) | PCB generator | |||||
| 5m | 23.67 | 23.41 | 23.23 | 23.12 | 23.08 | 46.30 | szerokość 8mm, miedziak Grubość: 25/50 μm | |||||
| 4m | 23.76 | 23.56 | 23.45 | 23.42 | 38.10 | |||||||
| 3m | 23.85 | 23.74 | 23.70 | 29.20 | ||||||||
| 2m | 23.95 | 23.91 | 19.80 | |||||||||
| 1m | 24.00 | 10.10 | ||||||||||
| Uwaga: Wartość środkowa reprezentuje napięcie, z jednostkami w woltach (V). | ||||||||||||
| Napięcie opadać spróbowanie zgłaszać dla 480 diod LED/m 12V KACZAN LED Pasek | ||||||||||||
| Długość | 1m | 2m | 3m | 4m | 5m | 6m | 7m | 8m | 9m | 10m | Moc (W) | PCB generator |
| 10m | 11.33 | 10.97 | 10.73 | 10.57 | 10.46 | 10.38 | 10.33 | 10.29 | 10.27 | 10.26 | 24.70 | Szerokość 8mm miedziak Grubość: 25/25 μm |
| 9m | 11.33 | 10.98 | 10.74 | 10.58 | 10.47 | 10.40 | 10.35 | 10.32 | 10.31 | 24.60 | ||
| 8m | 11.33 | 10.98 | 10.75 | 10.59 | 10.49 | 10.43 | 10.39 | 10.38 | 24.40 | |||
| 7m | 11.33 | 10.98 | 10.76 | 10.62 | 10.52 | 10.47 | 10.45 | 24.20 | ||||
| 6m | 11.34 | 11.00 | 10.78 | 10.66 | 10.58 | 10.56 | 24.00 | |||||
| 5m | 11.35 | 11.02 | 11.83 | 10.73 | 10.70 | 23.50 | ||||||
| 4m | 11.38 | 11.08 | 10.93 | 10.88 | 22.60 | |||||||
| 3m | 11.44 | 11.20 | 11.13 | 21.00 | ||||||||
| 2m | 11.56 | 11.45 | 17.40 | |||||||||
| 1m | 11.80 | 10.60 | ||||||||||
| Uwaga: Wartość środkowa reprezentuje napięcie, z jednostkami w woltach (V). | ||||||||||||
| Napięcie opadać spróbowanie zgłaszać dla 528 diod LED/m 12V KACZAN LED Pasek | ||||||||||||
| Długość | 1m | 2m | 3m | 4m | 5m | Moc (W) | PCB generator | |||||
| 5m | 11.43 | 11.11 | 10.90 | 10.79 | 10.76 | 34.44 | Szerokość 10mm miedziak Grubość: 25/25 μm | |||||
| 4m | 11.45 | 11.17 | 11.01 | 10.96 | 32.88 | |||||||
| 3m | 11.52 | 11.31 | 11.23 | 29.52 | ||||||||
| 2m | 11.63 | 11.53 | 23.40 | |||||||||
| 1m | 11.89 | 14.40 | ||||||||||
| Uwaga: Wartość środkowa reprezentuje napięcie, z jednostkami w woltach (V). | ||||||||||||
| Napięcie opadać spróbowanie zgłaszać dla 528 diod LED/m 24V KACZAN LED Pasek | ||||||||||||
| Długość | 1m | 2m | 3m | 4m | 5m | 6m | 7m | 8m | 9m | 10m | Moc (W) | PCB generator |
| 10m | 23.37 | 22.93 | 22.57 | 22.29 | 22.07 | 21.89 | 21.77 | 21.69 | 21.64 | 21.62 | 70.80 | Szerokość 10mm miedziak Grubość: 25/25 μm |
| 9m | 23.38 | 22.95 | 22.61 | 22.34 | 22.60 | 21.97 | 21.87 | 22.04 | 21.80 | 69.36 | ||
| 8m | 23.40 | 22.98 | 22.66 | 22.41 | 22.23 | 22.11 | 22.03 | 22.01 | 67.20 | |||
| 7m | 23.42 | 23.03 | 22.73 | 22.52 | 22.36 | 22.28 | 22.24 | 64.80 | ||||
| 6m | 23.48 | 23.13 | 22.85 | 22.67 | 22.57 | 22.53 | 61.20 | |||||
| 5m | 23.52 | 23.22 | 23.00 | 22.88 | 22.83 | 55.92 | ||||||
| 4m | 23.61 | 23.36 | 23.21 | 23.16 | 48.96 | |||||||
| 3m | 23.70 | 23.53 | 23.47 | 39.84 | ||||||||
| 2m | 23.82 | 23.76 | 28.32 | |||||||||
| 1m | 23.94 | 15.20 | ||||||||||
| Uwaga: Wartość środkowa reprezentuje napięcie, z jednostkami w woltach (V). | ||||||||||||
Tabela statystyk wyników testów
| Pozycja | Lsedacja/m | Długość (m) | Napięcie rozruchowe (V) | punkt końcowy napięcie (V) | Napięcie Ddrętwy |
| 1 | 320 | 5 | 12 | 10.73 | 10.6% |
| 2 | 320 | 5 | 24 | 22.86 | 4.7% |
| 3 | 384 | 5 | 24 | 23.08 | 3.8% |
| 4 | 480 | 10 | 12 | 10.26 | 4.5% |
| 5 | 528 | 5 | 12 | 10.76 | 10.3% |
| 6 | 528 | 10 | 24 | 21.62 | 9.9% |
Wniosek
Przy zasilaniu 12 V spadki napięcia na rysunkach 1 i 5 wynoszą około 10%, co wskazuje na nieco wyższe wartości. Rysunek 4 wykazuje doskonałą wydajność przy niższym spadku napięcia o 4,5%.
Przy zasilaniu 24 V na figurach 2 i 3 wykazują spadek napięcia odpowiednio o 4,7% i 3,8%, co wskazuje na doskonałą wydajność. Rysunek 6 pokazuje spadek o 9,9%, który jest nieco wyższy. Rysunek 3 osiąga najniższy spadek ze względu na grubość folii miedzianej podłoża PCB grubość 50 μm – dwa razy grubość niż 25 μm grubości innych – co jest głównym powodem jego minimalnego spadku napięcia.
Wśród wyników testu spadku napięcia paska LED COB największy spadek wyniósł 10,6% na rysunku 1, podczas gdy najmniejszy to 3,8% na rysunku 3. Ich zakresy spadku napięcia mieszczą się w dopuszczalnych granicach, a wszystkie sześć pasków LED COB spełnia wymagania testowania produktu.
Załącznik: Standardy spadku napięcia LED w branży LED
Normy branżowe dotyczące spadku napięcia taśmy LED zazwyczaj odnoszą się do międzynarodowych specyfikacji, takich jak IEC 62717, z podstawowymi wymaganiami, w tym:
- Stabilność napięcia: zmiana prądu ≤ ±5% przy wahaniu napięcia znamionowego o ±10%
- Limit spadku napięcia: nie określono określonego procentu, ale napięcie zasilania musi pozostać stabilne w granicach ±0,2%
- Warunki testowe: Prowadzone w temperaturze 25°C ±1°C z wilgotnością względną ≤65%
W praktycznych zastosowaniach zaleca się, aby spadek napięcia dla systemów 12V był kontrolowany w zakresie 10%, podczas gdy systemy 24 V powinny utrzymywać go poniżej 5% Testowanie wymaga stałego źródła prądu, aby zapewnić działanie diod LED przy określonych wartościach prądu.
Powiązane posty