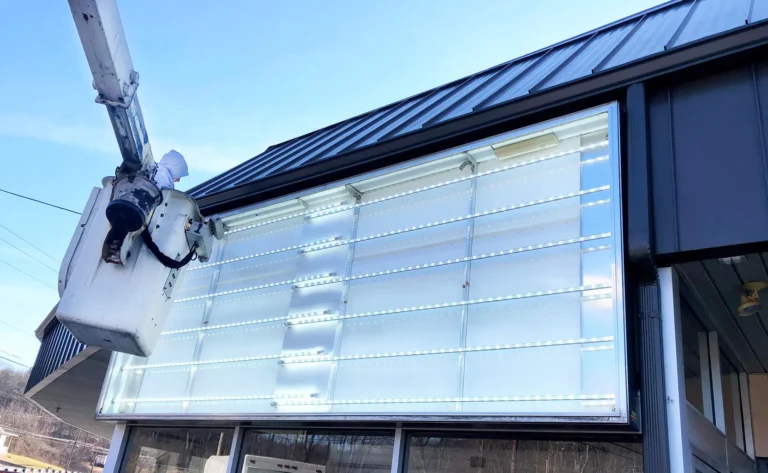
LED strips are widely used for decoration and lighting, but voltage drop issues often cause significant brightness reduction at the ends. This report, based on product test data developed by the engineering department, aims to evaluate voltage drop characteristics and provide guidance for production and installation.
Test Objective
This test report, completed by the Engineering Department, conducts systematic testing on voltage drop for LED strips (including SMD and COB strips). The objective is to verify the magnitude of voltage drop in standard strips and, based on the test data, evaluate whether the strip design is reasonable and meets user requirements, thereby enabling further improvements.
Measurement Equipment and Environment
- Digital Multimeter (FLUKE), 12V/24VDC Regulated Power Supply, Constant-Temperature Soldering Iron
- Temperature: 28°C ±5°C
- Humidity: 65% ±5%
Test Sample
A total of 12 pieces, including 6 pieces of SMD LED strips and 6 pieces of COB LED strips.
| SMD LED Strip | ||||
| Item | Number of LEDs | Voltage | Length of the LED Strip | PCB Width |
| 1 | 60 LEDs/m | 12V | 10m | 8mm |
| 2 | 120 LEDs/m | 12V | 10m | 8mm |
| 3 | 120 LEDs/m | 24V | 10m | 8mm |
| 4 | 120 LEDs/m | 24V | 5m | 5mm |
| 5 | 120 LEDs/m | 24V Constant Current | 5m | 10mm |
| 6 | 240 LEDs/m | 24V | 10m | 10mm |
| COB LED Strip | ||||
| Item | Number of LEDs | Voltage | Length of the LED Strip | PCB Width |
| 1 | 320 LEDs/m | 12V | 5m | 8mm |
| 2 | 320 LEDs/m | 24V | 5m | 8mm |
| 3 | 384 LEDs/m | 24V | 5m | 8mm |
| 4 | 480 LEDs/m | 12V | 10m | 8mm |
| 5 | 528 LEDs/m | 12V | 5m | 10mm |
| 6 | 528 LEDs/m | 24V | 10m | 10mm |
Testing Method
1) Adjust the DC power supply to output the correct voltage according to the LED strip’s voltage specifications. Verify the voltage accuracy using a multimeter.
2) Test the voltage value at the end point of each meter of LED strip using a multimeter and record the data.
3) Test the current data for each meter of LED strip using a multimeter. Calculate the power per meter using the formula P=UI and record the data.
4) After completing voltage and current measurements for each meter, solder the next meter of LED strip using a soldering iron. Repeat steps 2 and 3 until testing reaches the end point.
5) Record and preserve all data.
SMD LED Strip Voltage Drop Test Data
| Voltage Drop Test Report for 60LEDs/m 12V LED Strip | ||||||||||||
| Length | 1m | 2m | 3m | 4m | 5m | 6m | 7m | 8m | 9m | 10m | Power(W) | PCB Spec |
| 10m | 10.34 | 9.55 | 9.02 | 8.65 | 8.40 | 8.23 | 8.11 | 8.04 | 8.00 | 7.98 | 15.24 | Width 8mm copper thickness: 18/25μm |
| 9m | 10.55 | 9.69 | 9.12 | 8.73 | 8.47 | 8.29 | 8.18 | 8.12 | 8.10 | 15.12 | ||
| 8m | 10.56 | 9.70 | 9.13 | 8.76 | 8.51 | 8.35 | 8.26 | 8.24 | 15.00 | |||
| 7m | 10.55 | 9.71 | 9.16 | 8.80 | 8.58 | 8.46 | 8.41 | 14.88 | ||||
| 6m | 10.54 | 9.73 | 9.21 | 8.89 | 8.72 | 8.67 | 14.40 | |||||
| 5m | 10.57 | 9.80 | 9.33 | 9.08 | 8.89 | 14.16 | ||||||
| 4m | 10.67 | 9.97 | 9.60 | 9.48 | 13.56 | |||||||
| 3m | 10.81 | 10.28 | 10.10 | 12.36 | ||||||||
| 2m | 11.14 | 10.84 | 9.79 | |||||||||
| 1m | 11.64 | 5.77 | ||||||||||
| Note: The middle value represents voltage, with units in volts (V). | ||||||||||||
| Voltage Drop Test Report for 120LEDs/m 12V LED Strip | ||||||||||||
| Length | 1m | 2m | 3m | 4m | 5m | 6m | 7m | 8m | 9m | 10m | Power(W) | PCB Spec |
| 10m | 10.49 | 9.66 | 9.11 | 8.74 | 8.48 | 8.30 | 8.18 | 8.10 | 8.06 | 8.04 | 24.00 | Width 8mm, copper thickness: 35/35μm |
| 9m | 10.49 | 9.66 | 9.12 | 8.75 | 8.49 | 8.33 | 8.22 | 8.16 | 8.17 | 23.82 | ||
| 8m | 10.50 | 9.67 | 9.13 | 8.77 | 8.53 | 8.38 | 8.30 | 8.27 | 23.72 | |||
| 7m | 10.50 | 9.68 | 9.16 | 8.82 | 8.60 | 8.48 | 8.45 | 23.54 | ||||
| 6m | 10.51 | 9.72 | 9.22 | 8.91 | 8.74 | 8.69 | 23.19 | |||||
| 5m | 10.54 | 9.78 | 9.33 | 9.08 | 9.01 | 22.72 | ||||||
| 4m | 10.62 | 9.93 | 9.57 | 9.46 | 21.86 | |||||||
| 3m | 10.77 | 10.23 | 10.07 | 20.04 | ||||||||
| 2m | 11.05 | 10.82 | 16.20 | |||||||||
| 1m | 11.61 | 9.80 | ||||||||||
| Note: The middle value represents voltage, with units in volts (V). | ||||||||||||
| Voltage Drop Test Report for 120LEDs/m 24V LED Strip | ||||||||||||
| Length | 1m | 2m | 3m | 4m | 5m | 6m | 7m | 8m | 9m | 10m | Power(W) | PCB Spec |
| 10m | 22.56 | 21.50 | 20.67 | 20.01 | 19.49 | 19.10 | 18.80 | 18.60 | 18.49 | 18.46 | 41.95 | Width 8mm, copper thickness: 35/35μm |
| 9m | 22.58 | 21.56 | 20.76 | 20.14 | 19.67 | 19.31 | 19.08 | 18.94 | 18.89 | 41.00 | ||
| 8m | 22.63 | 21.64 | 20.88 | 20.31 | 19.89 | 19.61 | 19.43 | 19.38 | 40.15 | |||
| 7m | 22.70 | 21.75 | 21.06 | 20.56 | 20.21 | 20.01 | 19.94 | 38.40 | ||||
| 6m | 22.80 | 21.93 | 21.32 | 20.91 | 20.67 | 20.59 | 36.38 | |||||
| 5m | 22.91 | 22.14 | 21.66 | 21.37 | 21.28 | 33.36 | ||||||
| 4m | 23.06 | 22.48 | 22.13 | 22.02 | 29.47 | |||||||
| 3m | 23.28 | 22.89 | 22.77 | 24.00 | ||||||||
| 2m | 23.56 | 23.42 | 17.00 | |||||||||
| 1m | 23.91 | 9.00 | ||||||||||
| Note: The middle value represents voltage, with units in volts (V). | ||||||||||||
| Voltage Drop Test Report for 120LEDs/m 24V LED Strip | ||||||||||||
| Length | 1m | 2m | 3m | 4m | 5m | Power(W) | PCB Spec | |||||
| 5m | 23.33 | 22.92 | 22.63 | 22.47 | 22.42 | 21 | Width 5mm, copper thickness: 35/35μm | |||||
| 4m | 23.52 | 23.21 | 23.03 | 22.97 | 17.70 | |||||||
| 3m | 23.65 | 23.39 | 23.34 | 13.90 | ||||||||
| 2m | 23.72 | 23.63 | 9.30 | |||||||||
| 1m | 23.95 | 4.80 | ||||||||||
| Note: The middle value represents voltage, with units in volts (V). | ||||||||||||
| Voltage Drop Test Report for 120LEDs/m 24V Constant Current LED Strip | ||||||||||||
| Length | 1m | 2m | 3m | 4m | 5m | Power(W) | PCB Spec | |||||
| 5m | 22.65 | 21.93 | 21.42 | 21.12 | 21.02 | 80.64 | Width 10mm copper thickness: 25/25μm | |||||
| 4m | 22.92 | 22.41 | 22.11 | 22.00 | 63.12 | |||||||
| 3m | 23.25 | 22.94 | 22.83 | 47.52 | ||||||||
| 2m | 23.55 | 23.45 | 31.68 | |||||||||
| 1m | 23.84 | 16.08 | ||||||||||
| Note: The middle value represents voltage, with units in volts (V). | ||||||||||||
| Voltage Drop Test Report for 240LEDs/m 24V LED Strip | ||||||||||||
| Length | 1m | 2m | 3m | 4m | 5m | 6m | 7m | 8m | 9m | 10m | Power(W) | PCB Spec |
| 10m | 22.76 | 21.18 | 21.17 | 20.60 | 20.14 | 19.79 | 19.52 | 19.34 | 19.23 | 19.20 | 89.52 | Width 10mm copper thickness: 25/25μm |
| 9m | 22.80 | 21.95 | 21.27 | 20.74 | 20.32 | 20.00 | 19.80 | 19.68 | 19.64 | 86.80 | ||
| 8m | 22.88 | 22.08 | 21.45 | 20.97 | 20.62 | 20.37 | 20.22 | 20.18 | 83.52 | |||
| 7m | 22.96 | 22.22 | 21.65 | 21.24 | 20.95 | 20.78 | 20.73 | 78.91 | ||||
| 6m | 23.05 | 22.40 | 21.92 | 21.59 | 21.40 | 21.34 | 72.96 | |||||
| 5m | 23.18 | 22.62 | 22.24 | 22.58 | 21.96 | 65.40 | ||||||
| 4m | 23.33 | 22.91 | 22.66 | 22.58 | 55.92 | |||||||
| 3m | 23.51 | 23.23 | 23.15 | 44.44 | ||||||||
| 2m | 23.73 | 23.64 | 31.20 | |||||||||
| 1m | 23.97 | 16.00 | ||||||||||
| Note: The middle value represents voltage, with units in volts (V). | ||||||||||||
Test Results Statistics Table
| Item | LEDs/m | Length(m) | Starting Voltage(V) | Endpoint Voltage(V) | Voltage Drop |
| 1 | 60 | 10 | 12 | 7.98 | 33.5% |
| 2 | 120 | 10 | 12 | 8.04 | 33.0% |
| 3 | 120 | 10 | 24 | 18.46 | 23.1% |
| 4 | 120 | 5 | 24 | 22.42 | 6.6% |
| 5 | 120 | 5 | 24 | 21.02 | 12.4% |
| 6 | 240 | 10 | 24 | 19.2 | 20% |
Summary Analysis
For the 60 LEDs/m and 120 LEDs/m light strips in Tables 1 and 2, the voltage drops to 7.98V and 8.04V, respectively, at a 10-meter length. The maximum voltage drop reaches 33.5%, indicating a significantly excessive voltage drop. Since both 60-LED and 120-LED strips consist of three LEDs in series (3V x 3 = 9V), ideally, the voltage drop should be maintained above 9V. Therefore, the voltage drop values for these two LED strips need improvement. This can be achieved by widening the circuit board or thickening the copper foil, or by controlling the LED forward voltage (VF) within a range below 2.8V.
Tables 3, 4, 5, and 6 all use a DC 24V power supply with 6 LEDs in series. We calculate the voltage required for the LEDs in series: 3V x 6 = 18V. Among all endpoint test values, Table 3 shows the lowest voltage drop at 18.46 V, exceeding the 18 V requirement and essentially meeting the voltage for 6 LEDs in series, thus qualifying as acceptable. Figure 5 employs constant-current mode, maintaining consistent power output of 16 W/m at both ends with negligible brightness decay, demonstrating excellent consistency.
Causes of High Voltage Drop:
This primarily results from excessive strip length and current, increasing PCB resistance and “consuming” voltage. Excessive voltage drop directly causes noticeable dimming at the strip’s end and may even lead to color distortion.
COB LED Strip Voltage Drop Test Data
| Voltage Drop Test Report for 320LEDs/m 12V COB LED Strip | ||||||||||||
| Length | 1m | 2m | 3m | 4m | 5m | Power(W) | PCB Spec | |||||
| 5m | 11.40 | 11.07 | 10.87 | 10.77 | 10.73 | 25.20 | Width 8mm copper thickness: 25/25μm | |||||
| 4m | 11.40 | 11.10 | 10.95 | 10.90 | 24.00 | |||||||
| 3m | 11.45 | 11.21 | 11.14 | 22.80 | ||||||||
| 2m | 11.56 | 11.45 | 19.20 | |||||||||
| 1m | 11.81 | 12.00 | ||||||||||
| Note: The middle value represents voltage, with units in volts (V). | ||||||||||||
| Voltage Drop Test Report for 320LEDs/m 24V COB LED Strip | ||||||||||||
| Length | 1m | 2m | 3m | 4m | 5m | Power(W) | PCB Spec | |||||
| 5m | 23.58 | 23.26 | 23.03 | 22.90 | 22.86 | 33.60 | Width 8mm copper thickness: 25/25μm | |||||
| 4m | 23.65 | 23.38 | 23.23 | 23.00 | 29.76 | |||||||
| 3m | 23.75 | 23.57 | 23.51 | 23.18 | 24.40 | |||||||
| 2m | 23.88 | 23.82 | 17.20 | |||||||||
| 1m | 24.00 | 9.00 | ||||||||||
| Note: The middle value represents voltage, with units in volts (V). | ||||||||||||
| Voltage Drop Test Report for 384LEDs/m 24V COB LED Strip | ||||||||||||
| Length | 1m | 2m | 3m | 4m | 5m | Power(W) | PCB Spec | |||||
| 5m | 23.67 | 23.41 | 23.23 | 23.12 | 23.08 | 46.30 | Width 8mm, copper thickness: 25/50μm | |||||
| 4m | 23.76 | 23.56 | 23.45 | 23.42 | 38.10 | |||||||
| 3m | 23.85 | 23.74 | 23.70 | 29.20 | ||||||||
| 2m | 23.95 | 23.91 | 19.80 | |||||||||
| 1m | 24.00 | 10.10 | ||||||||||
| Note: The middle value represents voltage, with units in volts (V). | ||||||||||||
| Voltage Drop Test Report for 480LEDs/m 12V COB LED Strip | ||||||||||||
| Length | 1m | 2m | 3m | 4m | 5m | 6m | 7m | 8m | 9m | 10m | Power(W) | PCB Spec |
| 10m | 11.33 | 10.97 | 10.73 | 10.57 | 10.46 | 10.38 | 10.33 | 10.29 | 10.27 | 10.26 | 24.70 | Width 8mm copper thickness: 25/25μm |
| 9m | 11.33 | 10.98 | 10.74 | 10.58 | 10.47 | 10.40 | 10.35 | 10.32 | 10.31 | 24.60 | ||
| 8m | 11.33 | 10.98 | 10.75 | 10.59 | 10.49 | 10.43 | 10.39 | 10.38 | 24.40 | |||
| 7m | 11.33 | 10.98 | 10.76 | 10.62 | 10.52 | 10.47 | 10.45 | 24.20 | ||||
| 6m | 11.34 | 11.00 | 10.78 | 10.66 | 10.58 | 10.56 | 24.00 | |||||
| 5m | 11.35 | 11.02 | 11.83 | 10.73 | 10.70 | 23.50 | ||||||
| 4m | 11.38 | 11.08 | 10.93 | 10.88 | 22.60 | |||||||
| 3m | 11.44 | 11.20 | 11.13 | 21.00 | ||||||||
| 2m | 11.56 | 11.45 | 17.40 | |||||||||
| 1m | 11.80 | 10.60 | ||||||||||
| Note: The middle value represents voltage, with units in volts (V). | ||||||||||||
| Voltage Drop Test Report for 528LEDs/m 12V COB LED Strip | ||||||||||||
| Length | 1m | 2m | 3m | 4m | 5m | Power(W) | PCB Spec | |||||
| 5m | 11.43 | 11.11 | 10.90 | 10.79 | 10.76 | 34.44 | Width 10mm copper thickness: 25/25μm | |||||
| 4m | 11.45 | 11.17 | 11.01 | 10.96 | 32.88 | |||||||
| 3m | 11.52 | 11.31 | 11.23 | 29.52 | ||||||||
| 2m | 11.63 | 11.53 | 23.40 | |||||||||
| 1m | 11.89 | 14.40 | ||||||||||
| Note: The middle value represents voltage, with units in volts (V). | ||||||||||||
| Voltage Drop Test Report for 528LEDs/m 24V COB LED Strip | ||||||||||||
| Length | 1m | 2m | 3m | 4m | 5m | 6m | 7m | 8m | 9m | 10m | Power(W) | PCB Spec |
| 10m | 23.37 | 22.93 | 22.57 | 22.29 | 22.07 | 21.89 | 21.77 | 21.69 | 21.64 | 21.62 | 70.80 | Width 10mm copper thickness: 25/25μm |
| 9m | 23.38 | 22.95 | 22.61 | 22.34 | 22.60 | 21.97 | 21.87 | 22.04 | 21.80 | 69.36 | ||
| 8m | 23.40 | 22.98 | 22.66 | 22.41 | 22.23 | 22.11 | 22.03 | 22.01 | 67.20 | |||
| 7m | 23.42 | 23.03 | 22.73 | 22.52 | 22.36 | 22.28 | 22.24 | 64.80 | ||||
| 6m | 23.48 | 23.13 | 22.85 | 22.67 | 22.57 | 22.53 | 61.20 | |||||
| 5m | 23.52 | 23.22 | 23.00 | 22.88 | 22.83 | 55.92 | ||||||
| 4m | 23.61 | 23.36 | 23.21 | 23.16 | 48.96 | |||||||
| 3m | 23.70 | 23.53 | 23.47 | 39.84 | ||||||||
| 2m | 23.82 | 23.76 | 28.32 | |||||||||
| 1m | 23.94 | 15.20 | ||||||||||
| Note: The middle value represents voltage, with units in volts (V). | ||||||||||||
Test Results Statistics Table
| Item | LEDs/m | Length(m) | Starting Voltage(V) | Endpoint Voltage(V) | Voltage Drop |
| 1 | 320 | 5 | 12 | 10.73 | 10.6% |
| 2 | 320 | 5 | 24 | 22.86 | 4.7% |
| 3 | 384 | 5 | 24 | 23.08 | 3.8% |
| 4 | 480 | 10 | 12 | 10.26 | 4.5% |
| 5 | 528 | 5 | 12 | 10.76 | 10.3% |
| 6 | 528 | 10 | 24 | 21.62 | 9.9% |
Conclusion
Under 12V power supply, the voltage drops in Figures 1 and 5 are both around 10%, indicating slightly higher values. Figure 4 exhibits an excellent performance with a lower voltage drop of 4.5%.
Under 24V power supply, Figures 2 and 3 exhibit voltage drops of 4.7% and 3.8%, respectively, demonstrating excellent performance. Figure 6 shows a drop of 9.9%, which is slightly higher. Figure 3 achieves the lowest drop due to its PCB substrate copper foil thickness of 50 μm—twice as thick as the 25 μm thickness of others—which is the primary reason for its minimal voltage drop.
Among the COB LED strip voltage drop test results, the largest drop was 10.6% in Figure 1, while the smallest was 3.8% in Figure 3. Their voltage drop ranges fall within acceptable limits, and all six COB LED strips meet product testing requirements.
Appendix: LED Industry Voltage Drop Standards
Industry standards for LED strip voltage drop typically reference international specifications like IEC 62717, with core requirements including:
- Voltage Stability: Current variation ≤ ±5% when rated voltage fluctuates by ±10%
- Voltage Drop Limit: No specific percentage specified, but supply voltage must remain stable within ±0.2%
- Test Conditions: Conducted at 25°C ±1°C with relative humidity ≤65%
In practical applications, voltage drop for 12V systems is recommended to be controlled within 10%, while 24V systems should maintain it below 5%. Testing requires a constant current source to ensure LEDs operate at specified current values.
Related Posts